Our 2022 Neighborhood Perception Survey Results
Thursday June 8, 2023
Thank you to the nearly 1,100 respondents who shared their feedback this past January in our Neighborhood Perception Survey covering the 2022 calendar year. This survey is our organization’s most valuable tool for measuring the point-in-time sentiments of our stakeholder residents, office workers, property and business owners, and visitors. Survey participation was 22% higher than the previous year with your feedback providing MVT CID with valuable insights in support of making #LifeInMVT as enjoyable as possible for everyone in our community.
MVT CID fundamentally believes that the satisfaction of those who participate in our community is critical to the overall success of our organization. Because we’re all in this together. So as is the case every year, this summary overview is being shared publicly among our broader stakeholder community for transparency and to establish a common understanding of not just what we are doing well, but also areas for improvement.
Overall, we’re pleased that perceptions of some of our organization’s most important programmatic priorities have improved and are headed in the right direction after some drop-off from record-setting levels in prior years. Here’s a synopsis of what you told us:
Programmatic Priorities
Here’s how respondents ranked the programmatic priorities most important to them:
- Public Safety
- Cleanliness & Landscaping
- Business & Retail Attraction
- Parks & Open Space Activation
- Homeless Outreach
- Transportation & Mobility
- Art, Cultural Activation & “Placemaking”
- Marketing & Events
And here’s how respondents ranked the programmatic areas most in need of prioritization:
- Public Safety
- Homeless Outreach
- Parks & Open Space Activation
- Business & Retail Attraction
- Transportation & Mobility
- Art, Cultural Activation & “Placemaking”
- Cleanliness & Landscaping
- Marketing & Events
Public safety continues to rank as both a top programmatic priority and programmatic area in need of prioritization. But also notable is that homeless outreach – which ranked fifth highest in programmatic priority – ranked second highest in prioritization; and that cleanliness and landscaping –
which ranked second highest in programmatic priority – ranked seventh highest in prioritization. Additional details related to perceptions of cleanliness and safety – which all BIDs as “clean and safe” organizations hold as mandates – are shared further below. But with only 23% of survey respondents stating they were aware of our investments in homeless outreach services, we again want to remind our stakeholders about our investment in The h3 Project’s work to provide meaningful outreach and supportive services to individuals experiencing homelessness in Mount Vernon Triangle, with services provided six days per week. For more information about The h3 Project and its work to support neighbors experiencing homelessness in Mount Vernon Triangle, download the Homelessness “Who to Call” Fact Sheet also located on MountVernonTriangle.org.
Perceptions of Cleanliness & Clean Team Visibility
Mount Vernon Triangle continues to score high marks as a clean community, with perceptions of being “clean” or “very clean” being reported by nearly 4 out of 5 – or 78% – of survey respondents. It therefore comes as little surprise that nearly 7 out of 10 – or 69% – of survey respondents also report having “high” or “very high” perceptions of Clean Team Ambassador visibility, the clearest overall indicator of the role their presence has in delivering the results our stakeholders have come to expect. All credit for achieving these results belong to our hardworking Clean Team Ambassadors, who enhance our public spaces through services such as daily street cleaning, snow/ice removal, landscaping and leaf pick-up, and graffiti mitigation at a 97 percent annual uptime rate, with services not provided just 12 days out of the year. Our Clean Team program pays tremendous dividends, which is why it will continue to be our organization’s single-biggest programmatic investment.
Perceptions of Safety
Slightly more than half of survey respondents – 52% – indicated having perceptions of Mount Vernon Triangle as being a “safe” or “very safe” community, with “safe” – at nearly 45% – being the response selected most often among the four choices provided. Although being two percentage points higher from year-end 2021 and 16 percentage points higher from mid-year 2022, this 52% mark at year-end 2022 is admittedly still not near the level that we would like for this metric to be. Nevertheless, we will continue our everyday work of supporting our community’s ongoing safety through investments in the Metropolitan Police Department’s Reimbursable Detail Officer (RDO) Program, which enables the ability to provide enhanced foot patrols a much more visible presence across the community during periods of heavier pedestrian activity; continued advocacy for new and innovative approaches to public safety as we did for a new Safe Commercial Corridors Grants program; continued relationship building with our MPD First District partners, MVT stakeholders, and civic leaders in the communities that surround us; and the bread-and-butter baseline work that we do every day such as inspecting streetlights on a regular basis to ensure they are functional and in good order. We believe the cumulative effect of these strategies, tactics, and approaches can have a significant impact on instilling a sustainable “culture of safety” for our Mount Vernon Triangle community and will therefore continue to be a primary area of focus for our organization.
Perceptions of Civic Engagement & Community Pride (including FRESHFARM MVT Market)
After slipping into negative territory for the first time since 2016, we’re pleased that 52% of survey respondents ranked civic engagement and community pride within Mount Vernon Triangle as being “high” or “very high.” This is important because we view this metric as perhaps the single most important indicator of our community’s civic and social health. We will continue our focus on providing engaging and inclusive programming that unites our community and brings people together, such as the events and activations that accompany our weekly year-round FRESHFARM MVT Market, a program that is familiar to 90% of survey respondents and attended at least once per month by more than 60% of survey respondents. What’s more, nearly two thirds – or 65% – of survey respondents believe the offerings at the FRESHFARM MVT Market are either “more than enough” or “about just right.” With the growth of our FRESHFARM MVT Market surpassing the growth of the FRESHFARM network as a whole, we will continue to focus on making the market a destination where neighbors can shop for their daily staples from local and regional growers and producers while also share in the special joy of being together.
Perceptions of Green Space Availability
Perceptions regarding the quality, availability, and supply of green, open, and public-use spaces in Mount Vernon Triangle remain low, with only one out of four – or 26% – of respondents stating that they believe there to be sufficient access to this amenity and resource. Uses such as relaxation, aesthetics, dining, and event space continue to top the list of most desirable attributes for parks and open space in Mount Vernon Triangle. These needs are currently being addressed through the work underway to reactivate Cobb Park, which currently is in permitting review with DC government and is slated for construction start in late-summer/early-fall 2023.
Word Association
Positive indicators continue to top the list of words most used to describe Mount Vernon Triangle, with descriptors such as vibrant (54), convenient (51), central (43), convenient (33), home (23), nice (12), and fun (16) ranked in the top 30% of words cited most often by survey respondents.
Review Summary Trends Presentation >
Related Link: Special Message from MVT CID President & CEO Kenyattah Robinson
Related News
 January 5, 2023 January 5 Triangle Times
 September 14, 2017 Fun and Games and Workshops for PARK(ing) Day 2017
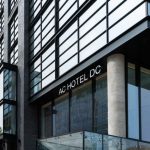 October 8, 2020 AC Hotel Washington, DC Convention Center Opens Its Doors October 5